Dax Tageschart
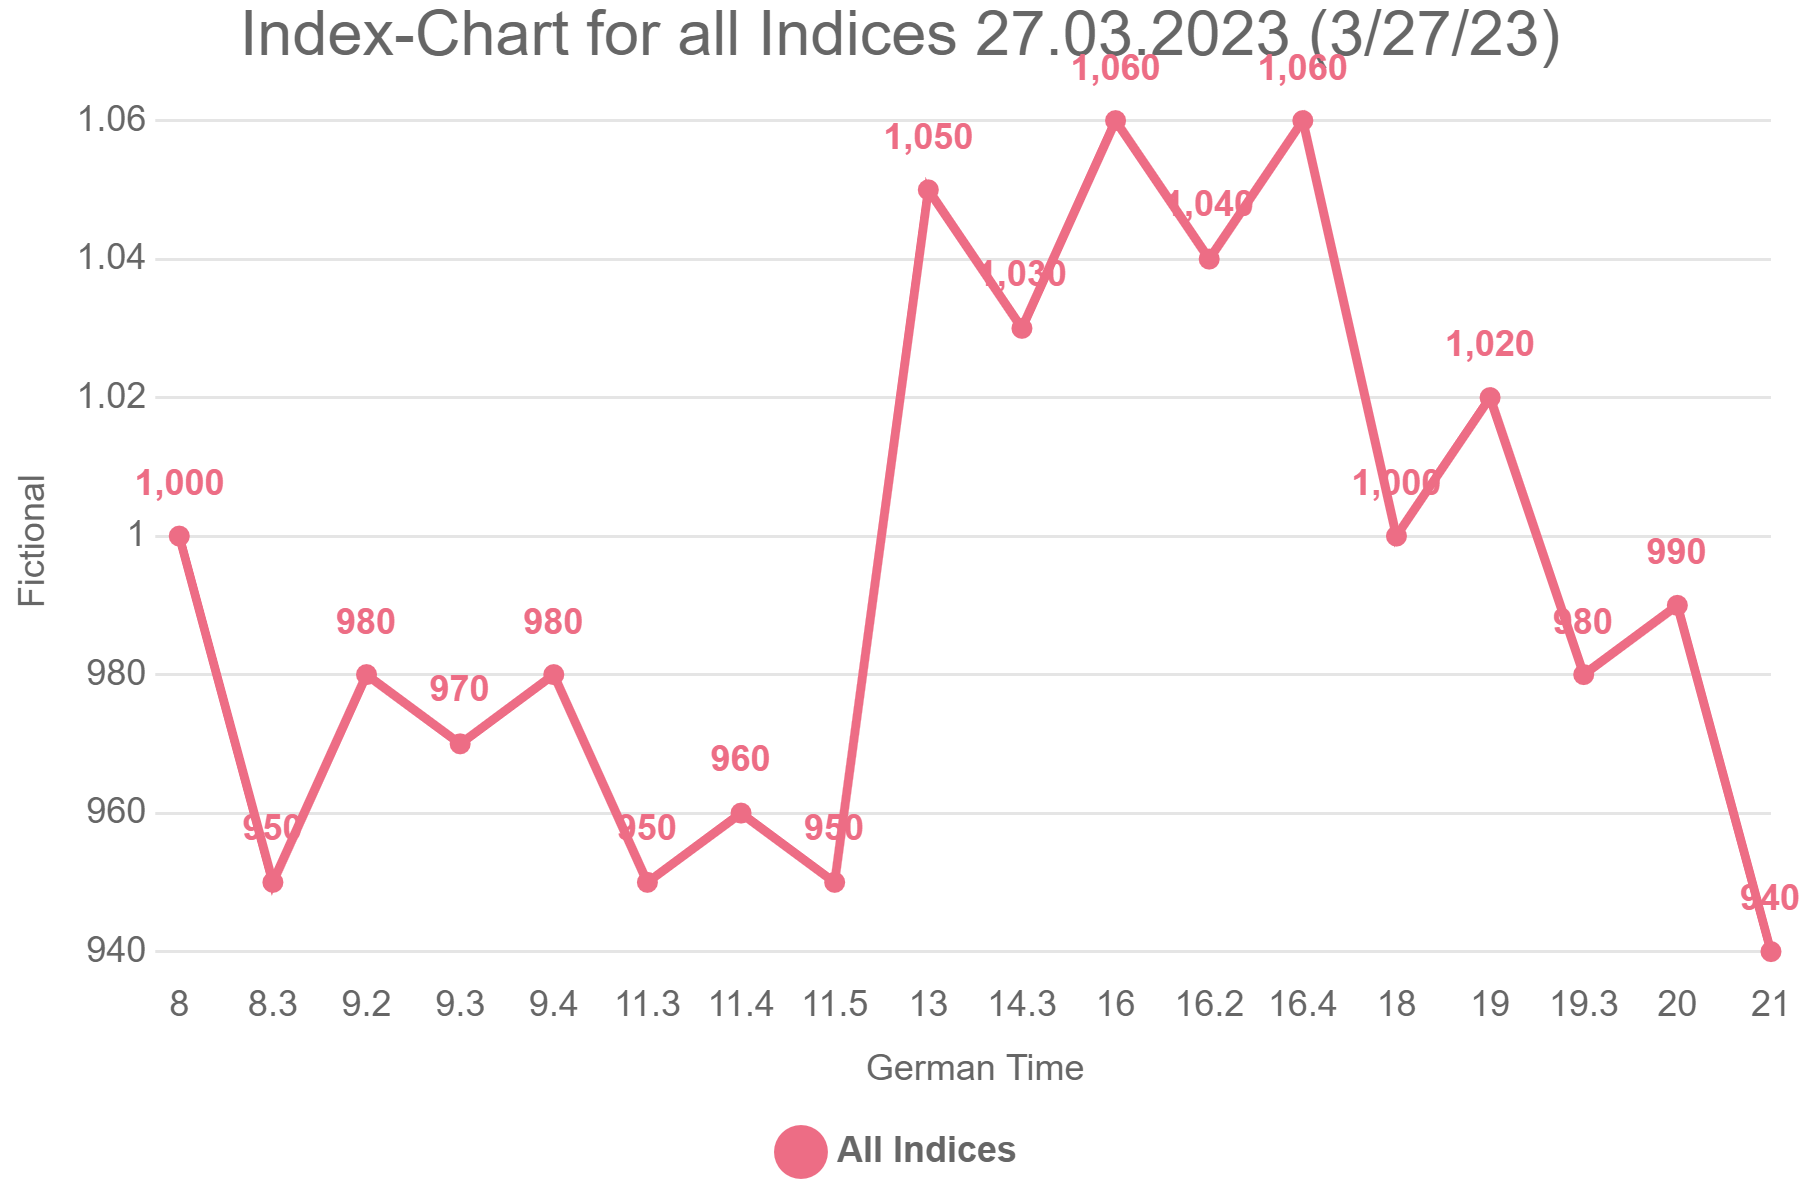
Das wird in der Zeit von 11.00 – 18.00 Uhr ein hoch volatiler Tag! Der Uranus wird zu dieser Zeit sein Unwesen treiben und ähnlich wirken, wie der Mittwoch, d. 22.03.23, 19 Uhr zu Fed-Entscheidung. D. h. es wird unruhig, es gibt wahrscheinlich starke Ausschläge nach unten und oben und am Ende, so ab ca. 17 Uhr (Hauptzeit 19.00 bis 21.00 Uhr) dürften die Indizes „stark“ verlieren.
Wenn Sie hier neu sind: Astrologie ist handeln nach Zeit, nicht nach Punkten! Die Wendemarken sind wichtig. Mein gedachter Chart, der sich auf die Indizes Dax, M-Dax, EuroStoxx, Dow Jones, S&P 500 und Nasdaq (diese haben zeitliche Abhängigkeiten zueinander) bezieht, kann am Ende anders aussehen, die Wendepunkte können höher oder tiefer ausfallen, von daher sind diese Chart nach Zeit sehr gut für Daytrader. Diese Art des Charts passt möglicherweise wie eine Schablone in Ihre technische Analyse und ist vielleicht eine tolle Ergänzung?
Finden Sie es einfach heraus.
This will be a highly volatile day in the time from 11 am – 6 pm! The Uranus will do his mischief at this time and act similarly, as the Wednesday, d. 3/22/23, 7 pm to Fed decision. I.e. it will be choppy, there are likely to be strong swings down and up and at the end, so from about 5 pm (prime time 7 – 9 pm) the indices are likely to lose „strongly“.
If you are new here: Astrology is trading by time, not by points! The turning points are important. My imaginary chart, which refers to the indices Dax, M-Dax, EuroStoxx, Dow Jones, S&P 500 and Nasdaq (these have time dependencies to each other) can look different in the end, the turning points can be higher or lower, from there these chart by time are very good for day traders. This type of chart may fit like a template in your technical analysis and may be a great addition?
Just find out.
